
New Study Finds 8-in-10 Californians Are Registered to Vote
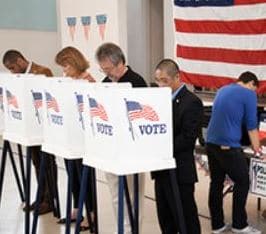
Voter registration is up in California, with 8-in-10 eligible adults registered. However, likely voters in the state still tend to be older, well-educated and disproportionately white, according to a study by the Public Policy Institute of California.
The Institute, a non-partisan public policy think tank, found that as of February 2019, 19.9 million of California’s 25.3 million eligible adults were registered to vote.
At 79.1% of eligible adults, this is an increase from the registration rate in 2015 (72.7%), the last year preceding a presidential election.
The share of registered voters who are Democrats (43.1%) is similar to what it was in 2015 (43.2%), while the share of Republicans (23.6%) has declined (28.0%).
At the same time, the share of voters who say they are independent (also known as “decline to state” or “no party preference”) has been increasing and is now 28.3%, up from 23.6% in 2015.
Dean Bonner, a research fellow at the Institute, told The Well News that one thing non-Californians should take away from the report is just how diverse California is.
“Further, while the state is diverse, those who turn out for elections tend to look differently than the general adult population—although that is changing,” he said.
Likely voters
Among likely voters in surveys conducted over the past year, 45% were Democrats, 27% were Republicans, 23% were independents, and 5% were registered with other parties.
Of those we consider infrequent voters, 41% were Democrats, 36% were independents, 20% were Republicans, and 4% were registered with other parties.
Among independent likely voters, 42% said they lean toward the Democratic Party, compared to 31% who lean toward the Republican Party and 26% who volunteer that they lean toward neither major party or were unsure.
Ideologically, 37% of likely voters self identify as politically liberal, 29% are moderate, and 34% are conservative.
Among infrequent voters, 32% consider themselves liberal, 36% consider themselves moderate, and 32% consider themselves conservative.
White, Older Residents Most Likely to Vote
Whites make up only 42% of California’s adult population but 58% of the state’s likely voters.
In contrast, Latinos comprise 35% of the adult population but just 19% of likely voters. Asian Americans make up 15% of adults and 13% of likely voters, while 6% of both adults and likely voters are African American.
“Other race” and multiracial adults make up 3% of the adult population and 4% of likely voters.
About four in ten (38%) infrequent voters are white, and 35% are Latino. Nearly six in ten unregistered adults are Latino (56%); fewer are white (21%), Asian American (18%), or African American (3%).
When it comes to who California’solder electorate might favor on primary day, Bonner said only time will tell.
However, he also said a survey the Institute released in July might offer some clues.
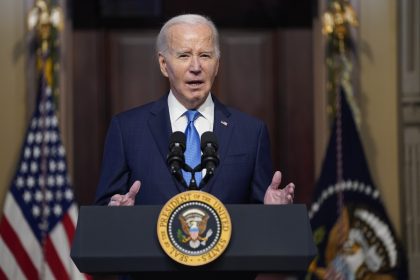
It found former Vice President Joe Biden doing much better among older than younger likely voters, and Senator Bernie Sanders doing much better among younger than older. Sen. Kamala Harris garnered the most support among the 45 and older group, the study found.
Older, Affluent, and Born in the U.S.A.
Californians ages 55 and older make up 32% of the state’s adult population but constitute 47% of likely voters.
Young adults (ages 18 to 34) make up 33% of adults but only 20% of likely voters, while adults ages 35 to 54 are proportionally represented.
Eight in ten likely voters either have some college education (41%) or are college graduates (41%); 18% have no college education.
Almost half of likely voters (46%) have annual household incomes of $80,000 or more, while 27% earn between $40,000 and $80,000 and 27% earn $40,000 or less.
A strong majority of likely voters (67%) are homeowners, while one-third (33%) are renters.
In contrast, 69% of unregistered adults and 64% of infrequent voters are renters. The vast majority of likely voters (83%) were born in the United States (17% are immigrants). Women (53%) and men (47%) make up similar shares of California’s likely voters.
Regional Distribution
The share of likely voters in each region mirrors the region’s share of the state’s overall adult population:
Los Angeles County (26% of adults, 26% of likely voters);
San Francisco Bay Area (20% of adults, 22% of likely voters);
Orange/San Diego Counties (17% of adults, 17% of likely voters);
Central Valley (17% of adults, 17% of likely voters); and
Inland Empire (11% of adults, 9% of likely voters).
The largest shares of infrequent voters (29%) and unregistered adults (25%) live in Los Angeles County.
This research was supported with funding from the James Irvine Foundation.