

Wind Accounted for Half of All Renewable Energy Output in US in March
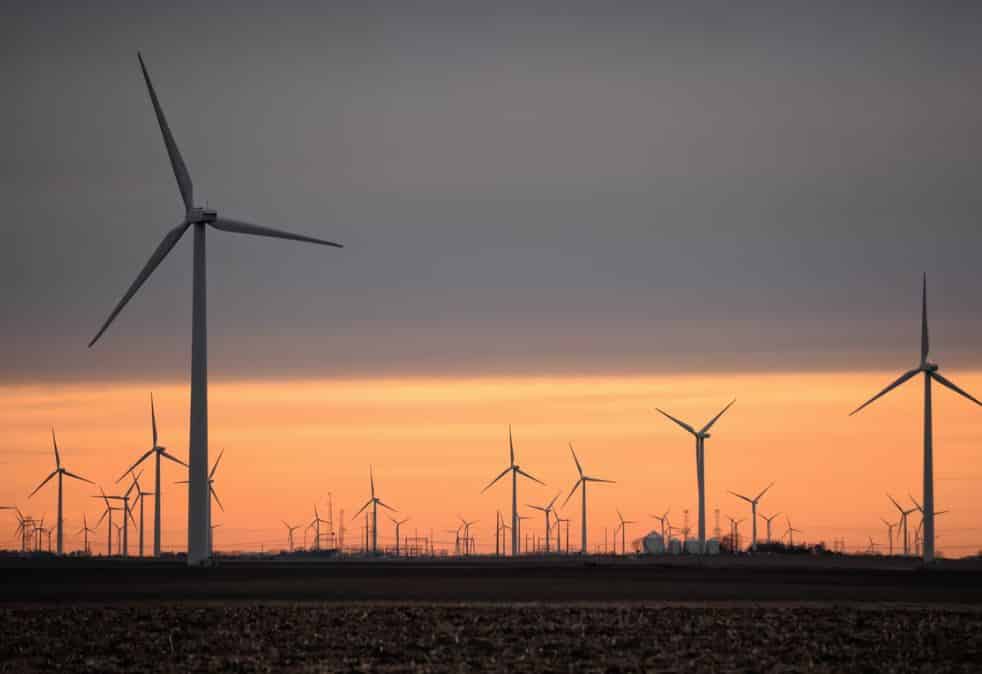
NEW YORK — Power generated in the United States by the wind reached 43.2 million MWh in March, accounting for nearly half of the total renewable energy output in the nation, a new analysis by S&P Global Market Intelligence has found.
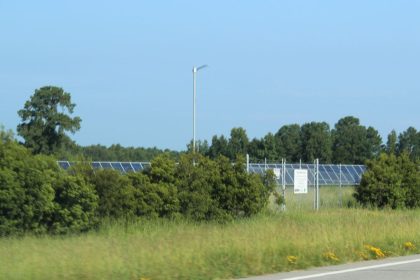
The total is nearly four times the amount — 111.9 MWh — generated by solar facilities across the country.
Overall, according to S&P Global Market Intelligence researchers, utility-scale power generation rose 4.4% in the first quarter of 2022, to 1.03 billion MWh, with natural gas supplying 35.2% of the nation’s power, coal 21.2%, and renewable energy 23.5%, up from 20.8% a year ago.
Wind accounted for 11.6% of U.S. power generation and conventional hydro accounted for 7.4%.
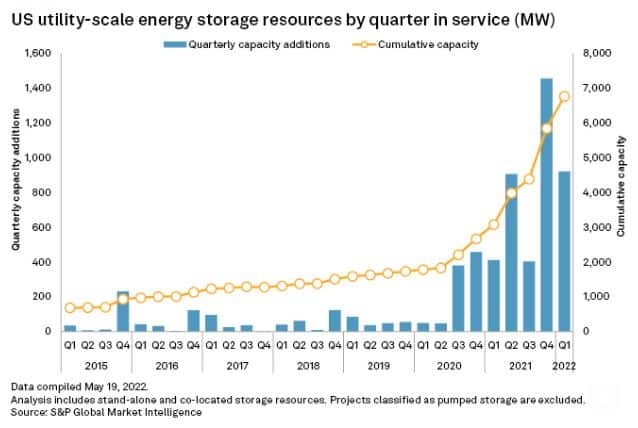
A strong start to the year also pushed total operating non hydroelectric power storage capacity higher in the U.S. to nearly 6,800 MW, mostly in the form of one- to four-hour lithium-ion battery systems, according to data supplied by the company.
Over the same period, gas-fired generation climbed 5.1% to 112.0 million MWh, accounting for 34.4% of the net total.
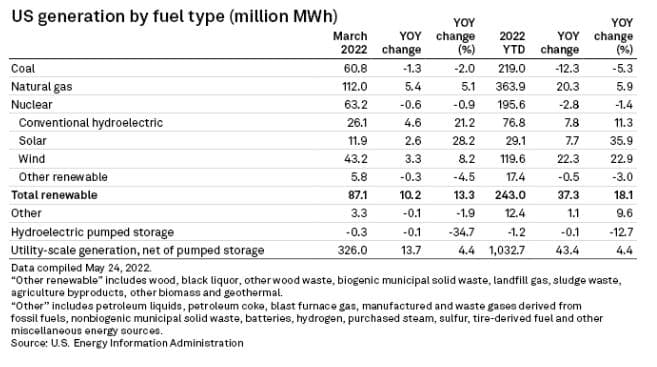
The data comes directly from the Energy Information Administration’s Electric Power Monthly report that was released in May for March data.
“Total renewables” includes conventional hydro, solar, wind and other renewables as seen in the table. While solar’s year over year percentage gains are higher, wind has a larger share of total renewables purely from the data standpoint. Very generally, wind projects are larger and generate more power than most solar projects.
For March in particular, wind capacity jumped due to some large wind farms coming online.
The Traverse Wind Energy Center is the last phase out of three, of a very large wind project, North Central Energy Facilities, and accounts for almost 1,000 MW of new wind capacity online in March by itself.
Also, the top four completed projects in March by capacity are powered by wind and together make up over 1,600 MW of new wind capacity.
Year Over Year Statistics
But that’s only part of the story, when it comes to coal-fired generation. The sector actually saw a decline of 2.0% versus the prior-year period to 60.8 million MWh, to account for 18.6% of the nation’s electricity.
Renewable output climbed 13.3% year over year to 87.1 million MWh, approximately half the level of fossil fuel contributions and accounting for roughly a quarter of U.S. electricity.
As for renewables, solar took up the lead for the largest year-over-year percentage gain at 28.2%.
Energy Storage
New energy storage resources, mostly one- to four-hour lithium-ion battery systems, totaled 921 MW of installed power capacity in the first three months of the year, more than doubling from the first quarter of 2021, according to S&P Global Market Intelligence data.
While down nearly 37% from last year’s fourth quarter, it marked the second-best quarter yet for electrochemical energy storage.
The biggest new assets entering operation in the quarter were Goldman Sachs Renewable Power LLC’s 140.3-MW/561.2-MWh Slate Solar Project and Terra-Gen LLC’s 140-MW/560-MWh Valley Center Battery Storage Project.
The first-quarter performance pushed total operating non hydroelectric power storage capacity in the U.S. to nearly 6,800 MW, with the Southwest and Texas together accounting for about 75% of the total.
S&P Global Market Intelligence reports another 16.4 GW is planned to enter service in 2023, followed by almost 12 GW in 2024, for a total of 38.1 GW of planned power storage additions from 2022 to the end of 2024, Market Intelligence data shows.
Significant additional volumes are planned in Arizona, Nevada, New Mexico and Utah, combining for 7.7 GW.
More than 2.1 GW is also planned in New York through 2025, in addition to 115 MW in operation.
The state has goals of reaching 1.5 GW of energy storage by 2025 and 3 GW by 2030.
Dan can be reached at [email protected] and at https://twitter.com/DanMcCue.